
grafana的配置文件
很多时候,组件都是需要自定义安装,所以我们必须要了解组件的配置文件,然后根据自己的需求修改配置文件。
app_mode:应用名称,默认是production

[path]
data:一个grafana用来存储sqlite3、临时文件、回话的地址路径
logs:grafana存储logs的路径

[server]
http_addr:监听的ip地址,,默认是0.0.0.0
http_port:监听的端口,默认是3000
protocol:http或者https,,默认是http
domain:这个设置是root_url的一部分,当你通过浏览器访问grafana时的公开的domian名称,默认是localhost
enforce_domain:如果主机的header不匹配domian,则跳转到一个正确的domain上,默认是false
root_url:这是一个web上访问grafana的全路径url,默认是%(protocol)s://%(domain)s:%(http_port)s/
router_logging:是否记录web请求日志,默认是false
cert_file:如果使用https则需要设置
cert_key:如果使用https则需要设置

[database]
grafana默认需要使用数据库存储用户和dashboard信息,默认使用sqlite3来存储,你也可以换成其他数据库
type:可以是mysql、postgres、sqlite3,默认是sqlite3
path:只是sqlite3需要,定义sqlite3的存储路径
host:只是mysql、postgres需要,默认是127.0.0.1:3306
name:grafana的数据库名称,默认是grafana
user:连接数据库的用户
password:数据库用户的密码
ssl_mode:只是postgres使用


[security]
admin_user:grafana默认的admin用户,默认是admin
admin_password:grafana admin的默认密码,默认是admin
login_remember_days:多少天内保持登录状态
secret_key:保持登录状态的签名
disable_gravatar:


[users]
allow_sign_up:是否允许普通用户登录,如果设置为false,则禁止用户登录,默认是true,则admin可以创建用户,并登录grafana
allow_org_create:如果设置为false,则禁止用户创建新组织,默认是true
auto_assign_org:当设置为true的时候,会自动的把新增用户增加到id为1的组织中,当设置为false的时候,新建用户的时候会新增一个组织
auto_assign_org_role:新建用户附加的规则,默认是Viewer,还可以是Admin、Editor


[auth.anonymous]
enabled:设置为true,则开启允许匿名访问,默认是false
org_name:为匿名用户设置组织名称
org_role:为匿名用户设置的访问规则,默认是Viewer


[auth.github]
针对github项目的,很明显,呵呵
enabled = false
allow_sign_up = false
client_id = some_id
client_secret = some_secret
scopes = user:email
auth_url = https://github.com/login/oauth/authorize
token_url = https://github.com/login/oauth/access_token
api_url = https://api.github.com/user
team_ids =
allowed_domains =
allowed_organizations =


[auth.google]
针对google app的,呵呵
enabled = false
allow_sign_up = false
client_id = some_client_id
client_secret = some_client_secret
scopes = https://www.googleapis.com/auth/userinfo.profile https://www.googleapis.com/auth/userinfo.email
auth_url = https://accounts.google.com/o/oauth2/auth
token_url = https://accounts.google.com/o/oauth2/token
api_url = https://www.googleapis.com/oauth2/v1/userinfo
allowed_domains =


[auth.basic]
enabled:当设置为true,则http api开启基本认证


[auth.ldap]
enabled:设置为true则开启LDAP认证,默认是false
config_file:如果开启LDAP,指定LDAP的配置文件/etc/grafana/ldap.toml


[auth.proxy]
允许你在一个HTTP反向代理上进行认证设置
enabled:默认是false
header_name:默认是X-WEBAUTH-USER
header_property:默认是个名称username
auto_sign_up:默认是true。开启自动注册,如果用户在grafana DB中不存在

[analytics]
reporting_enabled:如果设置为true,则会发送匿名使用分析到stats.grafana.org,主要用于跟踪允许实例、版本、dashboard、错误统计。默认是true
google_analytics_ua_id:使用GA进行分析,填写你的GA ID即可


[dashboards.json]
如果你有一个系统自动产生json格式的dashboard,则可以开启这个特性试试
enabled:默认是false
path:一个全路径用来包含你的json dashboard,默认是/var/lib/grafana/dashboards


[session]
provider:默认是file,值还可以是memory、mysql、postgres
provider_config:这个值的配置由provider的设置来确定,如果provider是file,则是data/xxxx路径类型,如果provider是mysql,则是user:password@tcp(127.0.0.1:3306)/database_name,如果provider是postgres,则是user=a password=b host=localhost port=5432 dbname=c sslmode=disable
cookie_name:grafana的cookie名称
cookie_secure:如果设置为true,则grafana依赖https,默认是false
session_life_time:session过期时间,默认是86400秒,24小时


以下是官方文档没有,配置文件中有的
[smtp]
enabled = false
host = localhost:25
user =
password =
cert_file =
key_file =
skip_verify = false
from_address = admin@grafana.localhost

[emails]
welcome_email_on_sign_up = false
templates_pattern = emails/*.html


[log]
mode:可以是console、file,默认是console、file,也可以设置多个,用逗号隔开
buffer_len:channel的buffer长度,默认是10000
level:可以是"Trace", "Debug", "Info", "Warn", "Error", "Critical",默认是info

[log.console]
level:设置级别

[log.file]
level:设置级别
log_rotate:是否开启自动轮转
max_lines:单个日志文件的最大行数,默认是1000000
max_lines_shift:单个日志文件的最大大小,默认是28,表示256MB
daily_rotate:每天是否进行日志轮转,默认是true
max_days:日志过期时间,默认是7,7天后删除
grafana自定义的URL
这个需求,我还是找了好几天的,毕竟第一次搞这样的配置;很多东西都是在网站上找,不断的去修改,去验证;虽然比较难,但是终于实现了,真不错。 需求是这样的: 加一层目录 3000:grafana/d 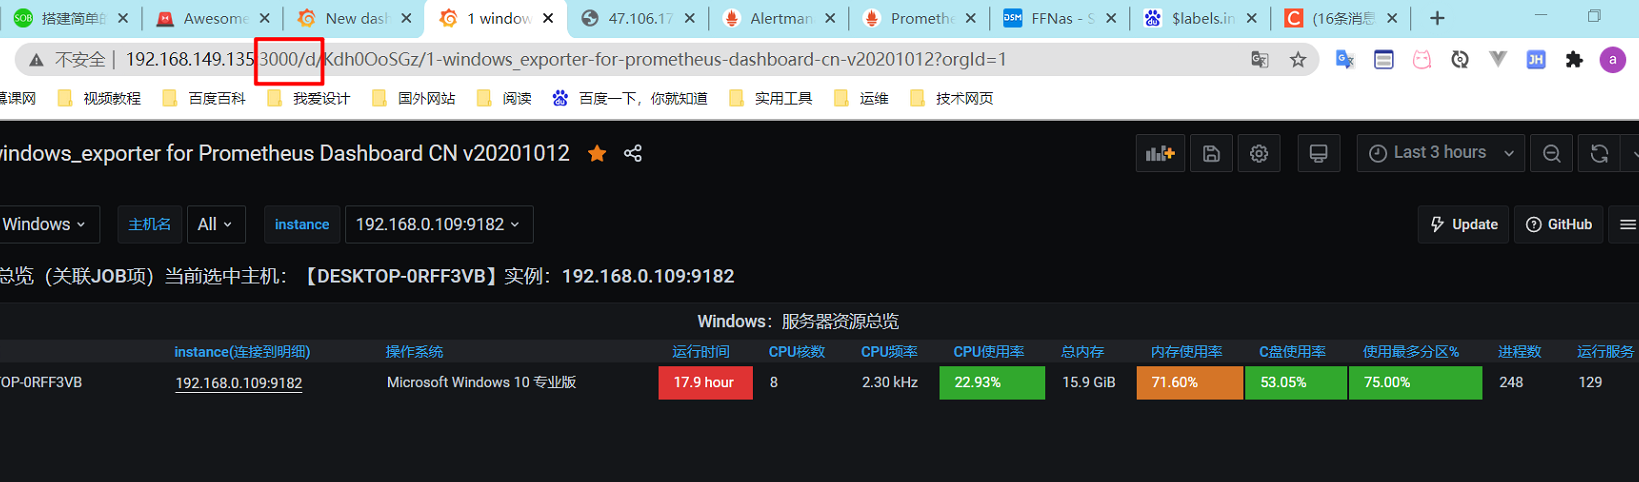 在配置的过程中遇到过很多的错误,比如比较常见的错误:
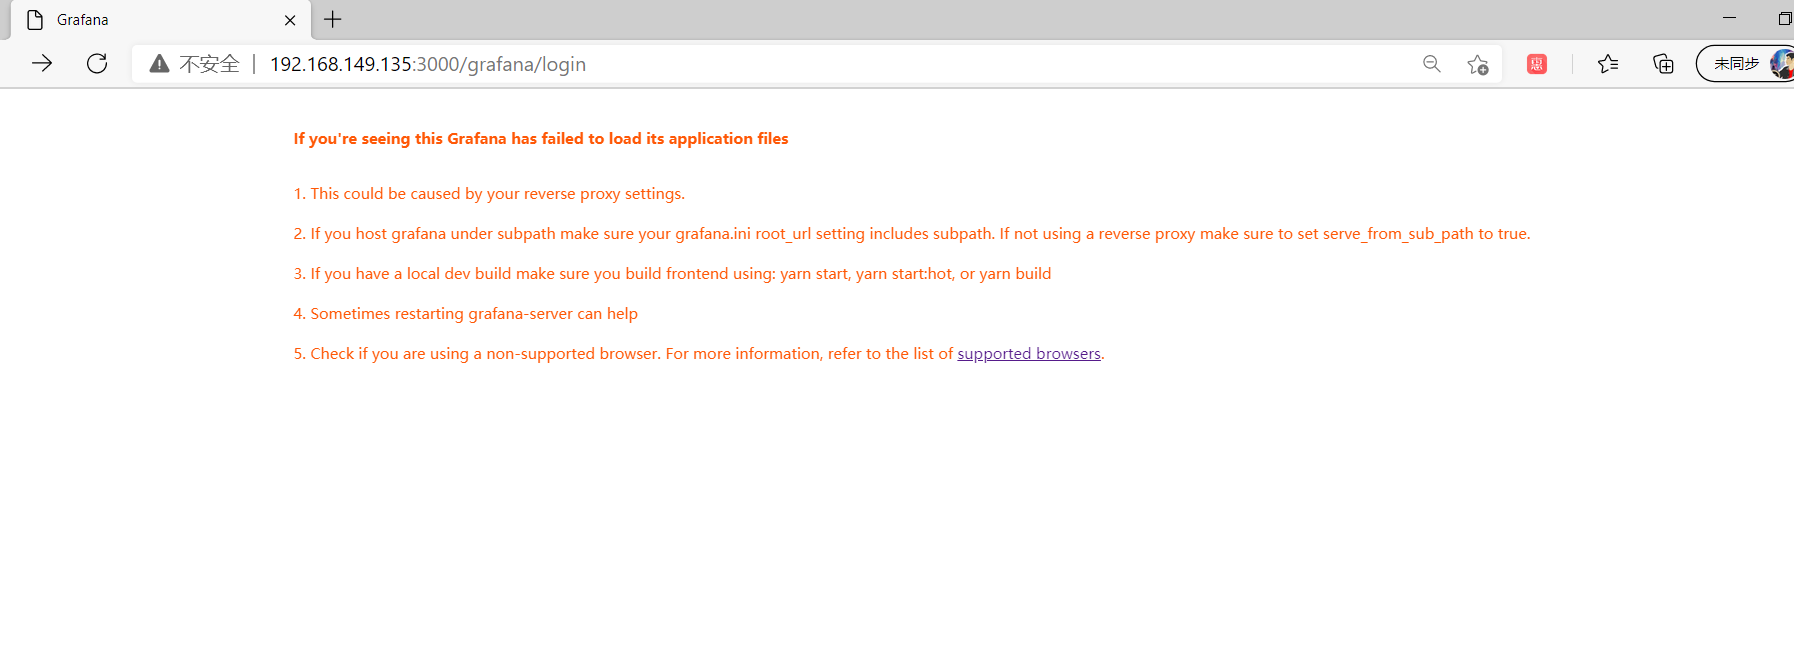
If you're seeing this Grafana has failed to load its application files

1. This could be caused by your reverse proxy settings.

2. If you host grafana under subpath make sure your grafana.ini root_url setting includes subpath

3. If you have a local dev build make sure you build frontend using: yarn start, yarn start:hot, or yarn build

4. Sometimes restarting grafana-server can help

如果您看到此Grafana无法加载其应用程序文件

 1。可能是由您的反向代理设置引起的。

 2.如果在子路径下托管grafana,请确保您的grafana.ini root_url设置包括子路径

 3.如果您具有本地开发版本,请确保使用以下命令构建前端:纱线开始,纱线开始:热或构建纱线

 4.有时重新启动grafana服务器可以帮助
 在这个时候我是非常想放弃的了,但是最后我还是坚持了下来,继续寻找答案。
正确的配置文件
##################### Grafana Configuration grafana.ini #####################
# use "--config" to specified via command line
# --config所指向的配置文件
# Everything has defaults so you only need to uncomment things you want to change
# 通过该文件我们可以覆盖default.ini的配置。
#以";"开头,不管多长或多短,独占一行(解开注释,去掉";")


# possible values : production, development
;app_mode = production

# grafana-server instance name, defaults to HOSTNAME environment variable value or hostname if HOSTNAME var is empty
# Used in logging and internal metrics and in clustering info
# use "echo ${HOSTNAME}" to view ${HOSTNAME} name
;instance_name = ${HOSTNAME}

#################################### Paths ####################################
[paths]
# Path to where grafana can store temp files, sessions, and the sqlite3 db (if that is used)
# use "cfg:default.paths.data" to specified via command line
data = /data/applications/grafana/data
#
# Directory where grafana can store logs
# use "cfg:default.paths.logs" to specified via command line
logs = /data/applications/grafana/logs
#
# Directory where grafana will automatically scan and look for plugins
# use "cfg:default.paths.plugins" to specified via command line
plugins = /data/applications/grafana/plugins

#################################### Server ####################################
[server]
# Protocol (http or https)
;protocol = http

;The ip address to bind to, empty will bind to all interfaces
;http_addr = 192.168.20.237

# The http port  to use, defaults to 3000
http_port = 3000

# The public facing domain name used to access grafana from a browser
;domain = 192.168.149.135

# Redirect to correct domain if host header does not match domain
# Prevents DNS rebinding attacks
;enforce_domain = false

# The full public facing url
root_url = http://localhost:3000/grafana/

# Serve Grafana from subpath specified in `root_url` setting. By default it is set to `false` for compatibility reasons.
serve_from_sub_path = true

# Log web requests
;router_logging = false

# the path relative working path(The path to the directory where the front end files (HTML, JS, and CSS files))
;static_root_path = public

# enable gzip
;enable_gzip = false

# https certs & key file(if protocol is set to https)
;cert_file =
;cert_key =

#################################### Database ####################################
[database]
# Grafana needs a database to store users and dashboards (and other things)
# Either "mysql", "postgres" or "sqlite3"(default), it's your choice
;type = sqlite3
# host : Only applicable to MySQL or Postgres. Includes IP or hostname and port
;host = 127.0.0.1:3306
# The name of the Grafana database
;name = grafana
;user = root
;password =

# For "postgres" only, either "disable", "require" or "verify-full"
;ssl_mode = disable

# For "sqlite3" only, path relative to data_path setting
;path = grafana.db

#################################### Session ####################################
[session]
# Either "memory", "file", "redis", "mysql", "postgres", default is "file"
provider = file

# Provider config options
# memory: not have any config yet
# file: session dir path, is relative to grafana data_path
# redis: config like redis server e.g. `addr=127.0.0.1:6379,pool_size=100,db=grafana`
# mysql: go-sql-driver/mysql dsn config string, e.g. `user:password@tcp(127.0.0.1:3306)/database_name`
# postgres: user=a password=b host=localhost port=5432 dbname=c sslmode=disable
;provider_config = sessions

# Session cookie name
cookie_name = grafana_sess

# If you use session in https only, default is false
;cookie_secure = false

# Session life time, default is 86400(in seconds,24h)
session_life_time = 86400

#################################### Analytics ####################################
[analytics]
# Server reporting, sends usage counters to stats.grafana.org every 24 hours.
# No ip addresses are being tracked, only simple counters to track
# running instances, dashboard and error counts. It is very helpful to us.
# Change this option to false to disable reporting.
reporting_enabled = true

# Set to false to disable all checks to https://grafana.net
# for new vesions (grafana itself and plugins), check is used
# in some UI views to notify that grafana or plugin update exists
# This option does not cause any auto updates, nor send any information
# only a GET request to http://grafana.net to get latest versions
;check_for_updates = true

# Google Analytics universal tracking code, only enabled if you specify an id here
;google_analytics_ua_id =

#################################### Security ####################################
[security]
# default admin user, created on startup
admin_user = admin
;admin_user = zhaojigang

# default admin password, can be changed before first start of grafana,  or in profile settings
admin_password = admin
;admin_password = zhaojigang

# used for signing(Used for signing keep me logged in / remember me cookies)
;secret_key = SW2YcwTIb9zpOOhoPsMm

# Auto-login remember days(The number of days the keep me logged in / remember me cookie lasts)
;login_remember_days = 7
;cookie_username = grafana_user
;cookie_remember_name = grafana_remember

# disable gravatar profile images
;disable_gravatar = false

# data source proxy whitelist (ip_or_domain:port separated by spaces)
;data_source_proxy_whitelist =

[snapshots]
# snapshot sharing options
;external_enabled = true
;external_snapshot_url = https://snapshots-origin.raintank.io
;external_snapshot_name = Publish to snapshot.raintank.io

#################################### Users ####################################
[users]
# disable user signup / registration(Set to false to prohibit users from being able to sign up / create user accounts. Defaults to true. The admin user
# can still create users from the Grafana Admin Pages)
;allow_sign_up = true

# Allow non admin users to create organizations(Set to false to prohibit users from creating new organizations)
;allow_org_create = true

# Set to true to automatically assign new users to the default organization (id 1)
;auto_assign_org = true

# Default role new users will be automatically assigned (if disabled above is set to true)
# other valid options are Admin and Editor and Read-Only Editor
;auto_assign_org_role = Viewer

# Background text for the user field on the login page
;login_hint = email or username

# Default UI theme ("dark" or "light")
;default_theme = dark

#################################### Anonymous Auth ##########################
[auth.anonymous]
# enable anonymous access
;enabled = false

# specify organization name that should be used for anonymous users
;org_name = Main Org.

# Specify role for anonymous users. Defaults to Viewer, other valid options are Editor and Admin
;org_role = Viewer

#################################### Github Auth ##########################
[auth.github]
;enabled = false
;allow_sign_up = false
;client_id = some_id
;client_secret = some_secret
;scopes = user:email,read:org
;auth_url = https://github.com/login/oauth/authorize
;token_url = https://github.com/login/oauth/access_token
;api_url = https://api.github.com/user
;team_ids =
;allowed_organizations =

#################################### Google Auth ##########################
[auth.google]
;enabled = false
;allow_sign_up = false
;client_id = some_client_id
;client_secret = some_client_secret
;scopes = https://www.googleapis.com/auth/userinfo.profile https://www.googleapis.com/auth/userinfo.email
;auth_url = https://accounts.google.com/o/oauth2/auth
;token_url = https://accounts.google.com/o/oauth2/token
;api_url = https://www.googleapis.com/oauth2/v1/userinfo
;allowed_domains =

#################################### Auth Proxy ##########################
[auth.proxy]
;enabled = false
;header_name = X-WEBAUTH-USER
;header_property = username
;auto_sign_up = true

#################################### Basic Auth ##########################
[auth.basic]
;enabled = true

#################################### Auth LDAP ##########################
[auth.ldap]
;enabled = false
;config_file = /etc/grafana/ldap.toml

#################################### SMTP / Emailing ##########################
[smtp]
;enabled = false
;host = localhost:25
;user =
;password =
;cert_file =
;key_file =
;skip_verify = false
;from_address = admin@grafana.localhost

[emails]
;welcome_email_on_sign_up = false

#################################### Logging ##########################
[log]
# Either "console", "file", "syslog". Default is console and  file
# Use space to separate multiple modes, e.g. "console file"
mode = file

# Either "trace", "debug", "info", "warn", "error", "critical", default is "info"
;level = info

# For "console" mode only
[log.console]
;level =

# log line format, valid options are text, console and json
;format = console

# For "file" mode only
[log.file]
level = into

# log line format, valid options are text, console and json
format = text

# This enables automated log rotate(switch of following options), default is true
;log_rotate = true

# Max line number of single file, default is 1000000
;max_lines = 1000000

# Max size shift of single file, default is 28 means 1 << 28, 256MB
;max_size_shift = 28

# Segment log daily, default is true
;daily_rotate = true

# Expired days of log file(delete after max days), default is 7
;max_days = 7

[log.syslog]
;level =

# log line format, valid options are text, console and json
;format = text

# Syslog network type and address. This can be udp, tcp, or unix. If left blank, the default unix endpoints will be used.
;network =
;address =

# Syslog facility. user, daemon and local0 through local7 are valid.
;facility =

# Syslog tag. By default, the process' argv[0] is used.
;tag =


#################################### AMQP Event Publisher ##########################
[event_publisher]
;enabled = false
;rabbitmq_url = amqp://localhost/
;exchange = grafana_events

;#################################### Dashboard JSON files ##########################
[dashboards.json]
enabled = ture
path = /data/applications/grafana/dashboards

#################################### Internal Grafana Metrics ##########################
# Metrics available at HTTP API Url /api/metrics
[metrics]
# Disable / Enable internal metrics
;enabled           = true

# Publish interval(Flush/Write interval when sending metrics to external TSDB.)
;interval_seconds  = 10

# Include this section if you want to send internal Grafana metrics to Graphite
; [metrics.graphite]
; address = localhost:2003
; prefix = prod.grafana.%(instance_name)s.

#################################### Internal Grafana Metrics ##########################
# Url used to to import dashboards directly from Grafana.net
[grafana_net]
url = https://grafana.net
效果图
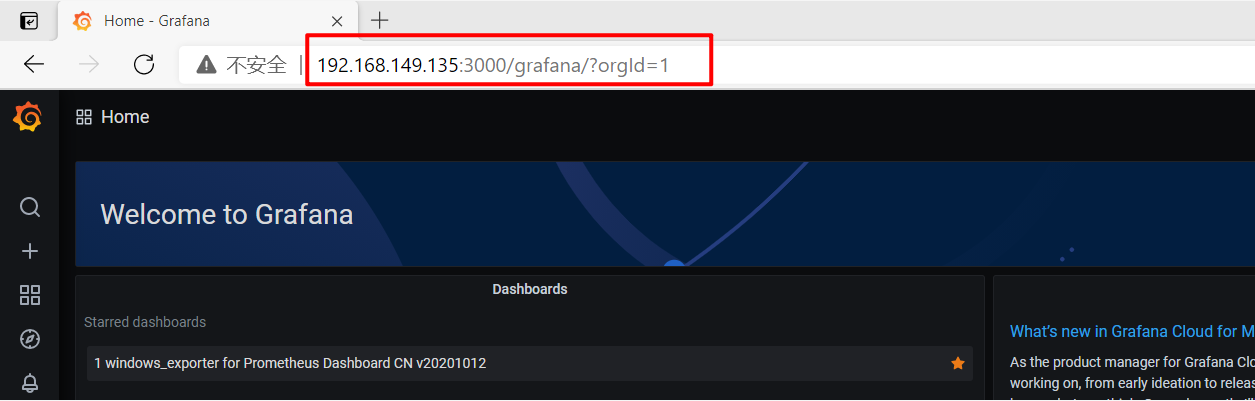 现在更改了路径,依然可以访问grafana啦。之前一直访问失败是因为一个重要的参数我的文件里没有,后面百度了很久,我找到了。参考链接:grafana官方文档 serve_from_sub_path
#这个参数很重要
# Serve Grafana from subpath specified in `root_url` setting. By default it is set to `false` for compatibility reasons.
serve_from_sub_path = ture